Building a Dashboard with Grafana
Article originally published on my former WordPress blog.
This long‑form write‑up summarizes a course project: designing a smart water‑metering network and visualizing data with Grafana.
0. Problem statement
Design a network of water meters and a dashboard to visualize individual and aggregate consumption.
1. Context
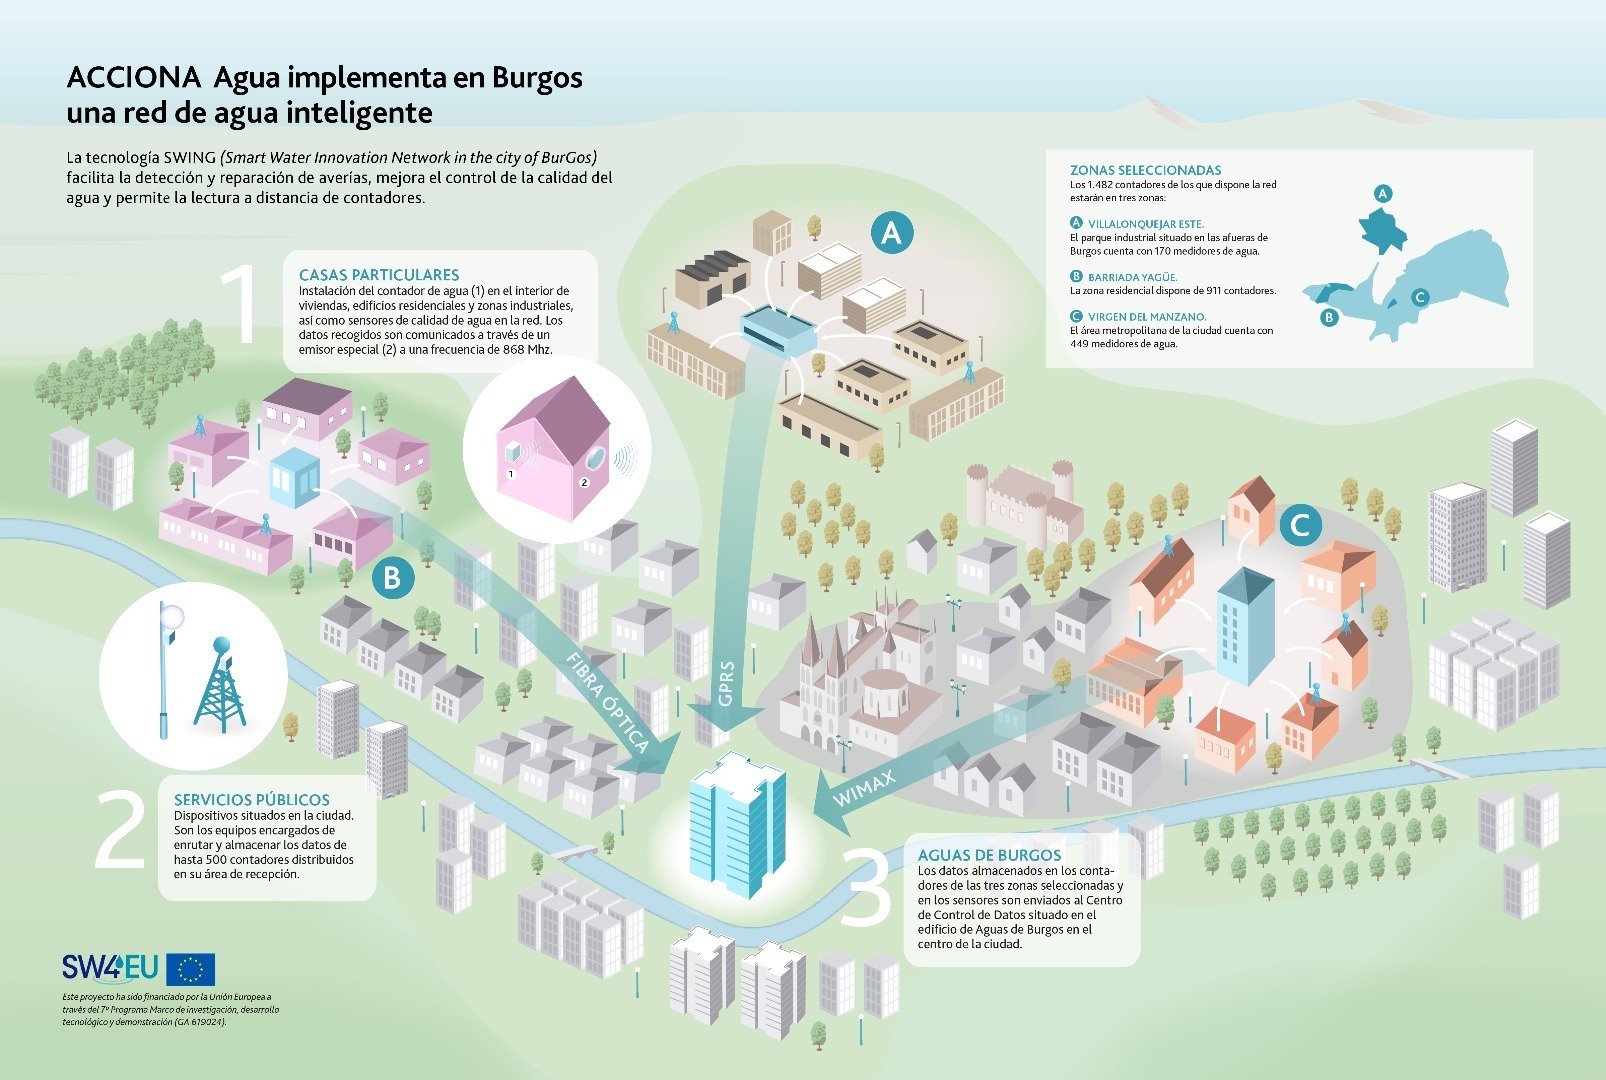
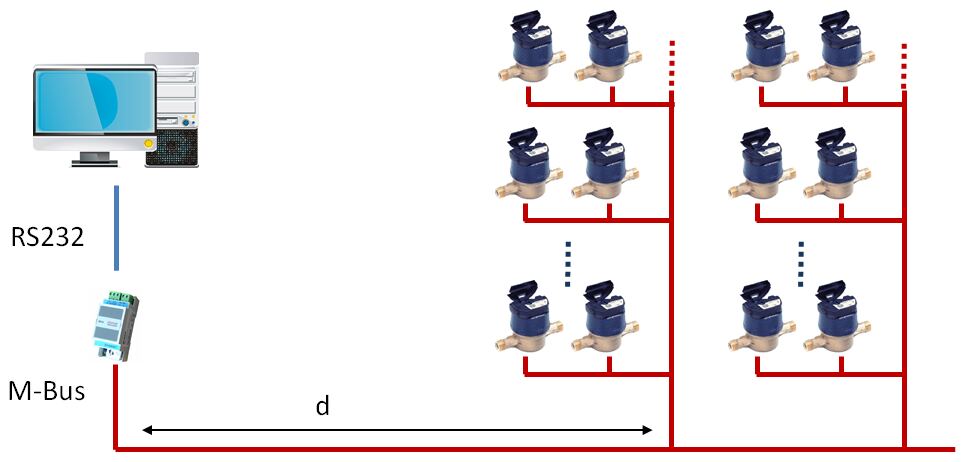
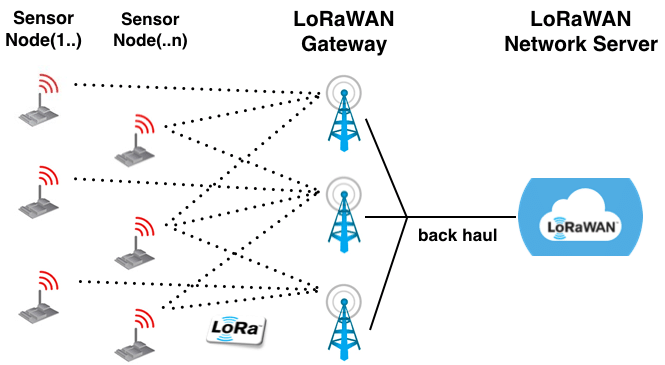
We review meter types, communication options (M‑Bus, LoRaWAN), and data needs.
2. Costs and trade‑offs
We estimate costs for both approaches. Although LoRaWAN reduces concentrators, installation and infra requirements can increase total cost versus M‑Bus.
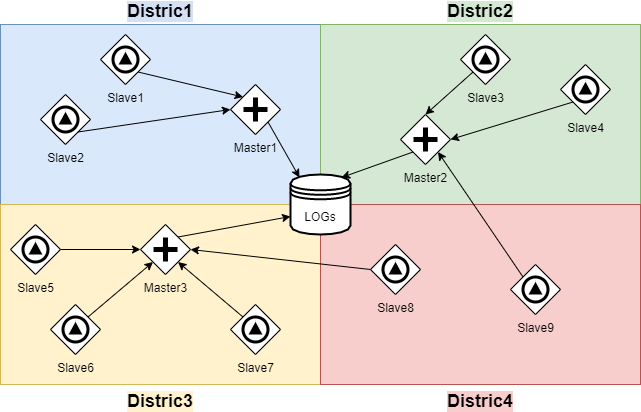
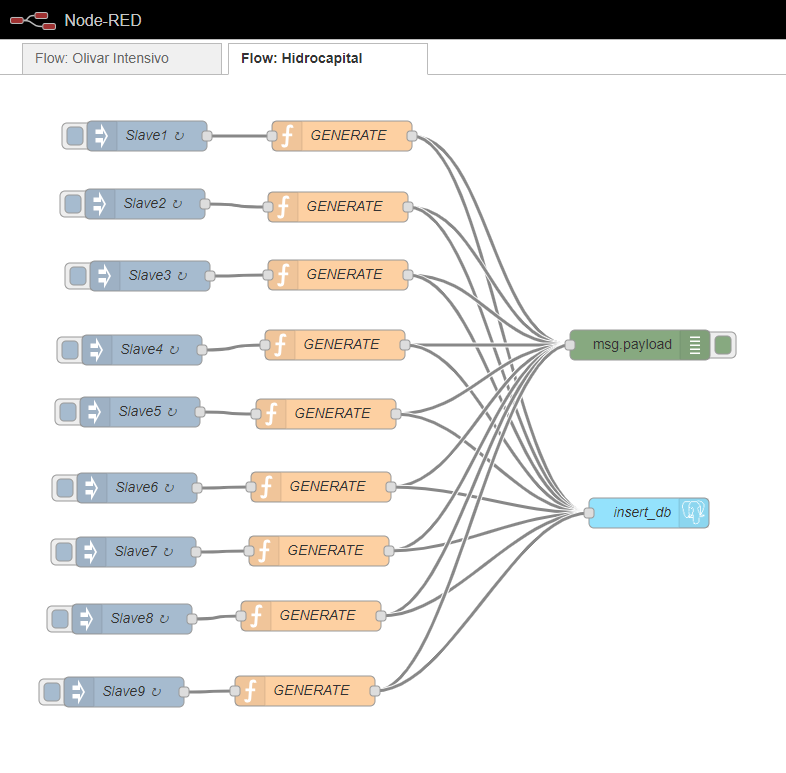
3. Data model & simulation
We define entities (districts, masters, slaves) and a logs table for historical readings. Data is simulated with Node‑RED and displayed in Grafana.
4. Conclusions
Grafana is flexible and powerful. Future work: better schema design, data generation realism, and alerting.